


WHO IS BROKE AND WHO IS BANKING IN D.C.?
- Apr 25, 2018
- 2 min read
According to the United States Census Bureau records, Washington D. C. has maintained one of the highest median incomes for the past five years, but millennials who plan to move to the District may be surprised to find disparity in wages and employment across race, community, and age.
RACE

CLICK HERE TO CHECK OUT AN INTERACTIVE CHART INCOME BY RACE IN D.C.
Chart by Sasha Strog
The 2015 Economic Report released by the Department of Employment Services shows that black unemployment in the District of Columbia is more than double the percent of whites. Although in recent years employment in D.C. has risen overall according to the Department of Employment Services, some people of color have not quite benefited from recent job growth. The United States Bureau of Labor Statistics reports that unemployment for whites and Asians in the District was 3.1 percent compared to 6.8 percent of blacks. Additionally, the wage gap among races is glaring. According to a 2016 report released by Georgetown University, the median income for whites in the District is $115,000 compared to $40,000 for blacks.
COMMUNITY
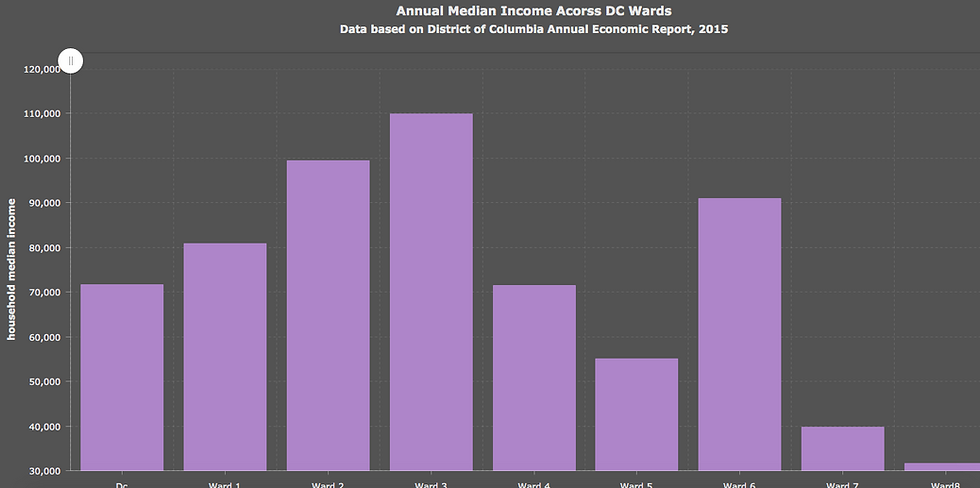
CLICK HERE TO CHECK OUT AN INTERACTIVE CHART INCOME BY WARD IN D.C.
Chart by Sasha Strong
Historically, wage disparities have also persisted across the capitals’ communities. Southeast D.C.’s Ward 8 has remained D.C.’s poorest ward for the past five years according to U.S. Census Records. According to the 2015 United States Census, the annual income for Ward 8 is a little over $30,000, while Ward 3’s annual income is $112,000. These numbers are on par with the 2015 U.S. Census that shows Ward 8 is over 95 percent black. Even more alarming, more than half of Washington D.C.’s poverty and people of color are concentrated East of the Anacostia River according to a report by Georgetown University. Unemployment can also dramatically vary by ward. The most recent unemployment rate in Ward 7 is 9.6 percent compared to 3.9 percent in Ward 2.
AGE

CLICK HERE TO CHECK OUT AN INTERACTIVE CHART OF INCOME BY AGE IN D.C.
Chart by Sasha Strong
Younger millennials moving to the District may also have trouble getting hired in D.C. The 2015 Economic Report released by the Department of Employment Services also showed that unemployment in the District of Columbia was highest among 16 to 24-year-olds. The District’s unemployment rate among White, African American, and Hispanic teens was lower than the corresponding rates nationwide according to the report. Aging millennials in D.C., however, have held a higher employment rate than the rest of the nation according to the same data.
SO WHO IS BROKE AND WHO IS BANKING IN D.C.?
Socio-Economic indicators suggest young black millennials most likely living in Southeast D.C have a harder challenge getting good paying jobs in D.C. than older white residents of Northwest. To get more Broke and Boujee News follow the Broke and Boujee D.C. Blog and social media.
Comments